
Hi,
I'm back for another Knitting and Crochet Blog Week post! Read the italicized text below to see what this post will be about.
Day Three (Wednesday April 24th): Infographic
There are many ways of conveying information on a blog; text and images being the two most widely used. Many infographics combine both these elements to provide a visual way of presenting text information.
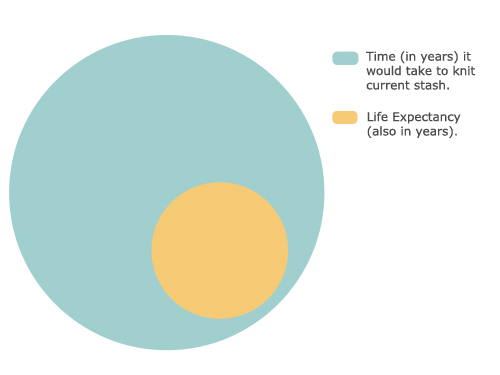
Make your own infogaphic (no fancy imaging software needed, you can draw it on paper and photograph it if you want) to convey any element of your craft(s). It can be just for fun or a thoroughly researched presentation of an idea/finding. Here is a very quick example that I made just for fun, which took me under three minutes.
There are many ways of conveying information on a blog; text and images being the two most widely used. Many infographics combine both these elements to provide a visual way of presenting text information.
Make your own infogaphic (no fancy imaging software needed, you can draw it on paper and photograph it if you want) to convey any element of your craft(s). It can be just for fun or a thoroughly researched presentation of an idea/finding. Here is a very quick example that I made just for fun, which took me under three minutes.
The whole point of this topic is to experiment with infographics as a way of sharing facts, information and ideas, and to explore another tool in a blogger's arsenal of communication options.
For more information and inspiration on infographics, look here. If you are looking for a quick and easy way to produce and infographic search the web for 'Infographic Maker' to find many free tools for making your own, or embrace the old school with some paper and a pencil.
So, I followed the directions, and created an infographic. And to be honest I think it turned out pretty cute!

Now I have a question for you: Are you like me (starts many projects but finishes only a small percentage) or are you the kind of person that starts something and goes all the way to the end? Let me know in the comments!
I work my projects from start to finish and usually only ever have one thing on the needles. Usually. Currently I have three projects on the needles but I'm only working on one. In my defense, that one project has a deadline so the other two have to wait, haha.
ReplyDelete